 Pardon the mess! The Support Center is undergoing construction.
 ![]()

August 30th, 2021
Miss Honey has an initiative to increase reading and library interaction with each grade level, but especially the 4th-grade class. How can she measure this? With checkouts, Researcher usage, and the right reports!
Patron Monthly Checkouts
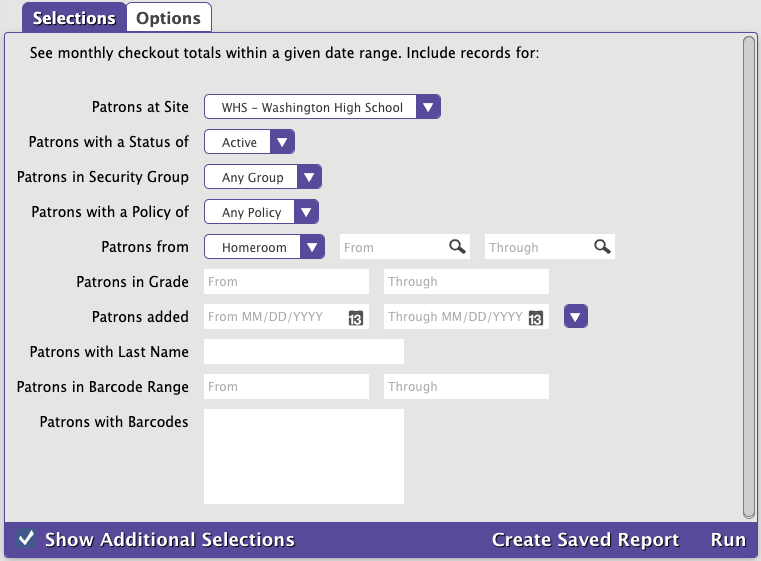
You can see some simple and helpful checkout numbers over time, by grade.
- Open Reports.
- Look in the Statistics / Usage category and click on the Patron Monthly Checkout Count report.
- Select by the grade or grade range you want to compare. Leave it blank to see all grades.
- Under the Options tab, sort by Grade.
- Optionally, fill in a date range to concentrate on a particular range of years.
- Run the report.
Miss Honey can compare the numbers month-by-month, over the years, and even with other grades to see how those 4th-graders are doing. Let's hope her efforts pay off with an upward trend!
Do you have a lot of ebooks? Ebook usage can be tracked when patrons click the access URL in Researcher. This is part of our Online Services Integration—call our Sales team at 1.800.347.6439 to learn more!
Researcher Usage
Miss Honey can also gauge patron involvement in the library by measuring their interactions with the different areas of Researcher.
- Open Reports.
- Look in the Statistics / Usage category and click on the Researcher Monthly Usage report.
- Select by a date range if you want to concentrate on a particular range of months. Since this is a new report, the data is limited to interactions after June 2021.
- Run the report.
Compare the usage over the months and, eventually, the years. If students don't know they can access their own account to renew items and suspend holds, you may hold particular lessons showing them how to use Status. After that, you would expect to see the access to Status go up in the next few months.
Remind yourself to review these statistics by scheduling the reports. Then you can aggregate the relevant data in a spreadsheet, and even make yourself some graphs!
There's a lot more you can do with your data...
Recent Posts
Blog Posts
-
Winter storms–recompute due dates
created by
Jan 23, 2024
-
How to add reports in the new beta–you beta be trying it!
created by
Jan 16, 2024
-
Site-specific eBooks
created by
Jan 10, 2024
-
User-friendly–optimize your setup
created by
Dec 01, 2023
-
The gift of keyboard shortcuts
created by
Nov 30, 2023
-
Builder: customize your search
created by
Nov 21, 2023
-
Maps makeover
created by
Nov 13, 2023
-
Making search strings using advanced search
created by
Nov 01, 2023
-
Popular items: creating explore panes
created by
Oct 25, 2023
-
Creating a slideshow for spooky season–or any reason!
created by
Oct 17, 2023
Want more tips?
Sign up for the emails!
How helpful was this page?
0 Comments