 Pardon the mess! The Support Center is undergoing construction.
 ![]()

Alexandria Statistics
Last Updated: $action.dateFormatter.formatDateTime($content.getLastModificationDate())

this page (and all tabs) has been moved to https://support.goalexandria.com/knowledge-base/alexandria-statistics/
Statistics are a powerful tool you can use to inform decisions concerning your library. With Alexandria statistics, you can see copy and title usage, which patrons do or don't use the library, popular titles and book types, which days and times your library is most active, and more. This information empowers you to make decisions about ordering new books, weeding, and library activities. You can even use statistics to justify costs to boards and administrators.
In Alexandria, there are two kinds of usage statistics: Monthly Usage and Circulation. To get the most out of these statistics, you'll need to set up your policies and Statistics Groups correctly.


General Best Practices
- Set up your policies at the beginning of the year.
- Keep all patron and item records throughout the year if Monthly Usage data is important. Removing them mid-year will mess with your statistics. Once you get your reports at the end of the year, then you can remove them!
- Only change a policy's Statistics Group if you have a clear reason for doing so and understand how they work.
Monthly Usage Statistics
For the three main record types (patrons, titles, and copies), Alexandria keeps record-specific monthly usage counts for each year. These are incremented whenever a checkout occurs or a 856 _u eResource link is clicked; there are no monthly usage counts for holds, reservations, or other circulation events.
For example, if Darla Anderson checks out Copy 1000 of The Hunger Games in June 2020, then the June counter in the 2020 record for each of those records is incremented by one.
Advantages
With these statistics, it’s possible to see monthly, yearly, or lifetime usage for each of these records. Additionally, when running reports, you can select by groups of similar records to obtain monthly, yearly, or lifetime totals for that particular group (e.g. grade, homeroom, title, author, call number, genre, etc).
Here are just a few examples of Alexandria's Monthly Usage statistics reports. Learn about more in the Reporting section!
Patron Monthly Checkout Count | Top Circulated Titles | Copy Monthly Checkout Count | Publication Date Summary |
These statistics are useful in answering basic checkout usage questions and identifying the total number of checkouts for a record or group of similar records. See the Uses section of this page for examples of specific questions these can answer.
It's important to note that Monthly Usage statistics don’t record the time of day the checkout occurred or the interactions between records. Continuing with the example above, we know that Darla Anderson, The Hunger Games, and Copy 1000 were all “used” once. But we don’t know it was Darla who used Copy 1000 of The Hunger Games between 10 and 11 AM. If you want information on these interactions, it’s best to use Circulation statistics instead!
Monthly Usage statistics reflect records currently in Alexandria, so deleting records will delete associated statistics. This is why it’s important to not delete patrons, titles, or copies until you have the statistics you need. Usually you’ll run reports to get this information at the end of the school year.
Uses
Here are some examples of information you can get from Monthly Usage statistics:
- Darla Anderson has checked out 37 items this year.
- Looks like she won the reading contest!
- Copy 1000 has been used 137 times and is getting old.
- Does it need to be repaired?
- Is it time to order a replacement?
- Patrons in 4th grade (grade selection) checked out 476 items in June.
- How does this number compare to the same group from last year?
- The Lightning Thief is a very popular title; it has been checked out more than any other book in your collection.
- Do you need to order more copies?
- The items on the Teacher Resources shelf (shelving selection) have been checked out only 7 times, and all were in January.
- Does this shelf need to be in a more visible area?
- Do teachers need to be reminded of these?
Reporting
Here are some Alexandria reports that use Monthly Usage statistics:
| Report Name | What does the report generate? |
|---|---|
| Patrons Reports | |
| Activity Summary | List of information gathered by Activity from a specified time period (dates, patrons, and activity reasons) |
| Library Usage Summary | Statistics on how many patrons used and didn't use your library in the month/year range you specify |
| Top Borrowing Patrons | List of patrons who have checked out the most items |
| Titles Reports | |
| Title Lifetime Usage | Statistics on total usage for each title (includes ebook usage statistics if you're registered for the Online Services bundle) |
| Title Year to Date Usage | Statistics on total year to date usage for each title |
| Top Circulated Titles | List of titles with the most checkouts |
| Copies Reports | |
| Copy Monthly Usage | Statistics showing total copy usage for each month within the last year |
| Copy Monthly Usage Detailed | Statistics showing total usage for each individual copy for each month in the last year |
| Copy Usage Details | Statistics on total usage for each copy, including total checkouts, total days used, and the last use date |
| Weeding List | List of poor condition or little used copies with their publication year, life to date use, and last use date |
| Statistics / Usage Reports | |
| Monthly Checkout per Patron | Statistics showing monthly usage for each individual patron within the specified date range |
| Patron Monthly Checkout Count | statistics showing how many items were checked out each month within the specified date range |
| Collection Analysis Reports | |
| Brief Analysis | Statistics on item counts, purchase costs, and replacement costs |
| Publication Date Summary | Title and copy statistics by publication year |
| Super Summary | Statistics that show the number of items in your collection and their value, the age of your items and average publication year, and usage information |
| Houston Super Summary | Detailed collection analysis with classifications used by the HISD |
| Missouri Super Summary | Detailed collection analysis using the Missouri standard call number classifications |
Circulation Statistics
Alexandria keeps a Circulation statistic record for each unique combination of date, hour, patron policy, item policy, patron site, and copy site. These are incremented for checkouts, check-ins, renewals, holds placed, and reservations placed.
For example, it’s recorded if a patron with the High School policy at Washington High School checked out an item with a Biography policy from Jefferson Middle School on a Monday between 10 and 11 AM.
Advantages
Circulation statistics allow you to analyze library usage patterns and interactions between various types of records.
For example, circulation statistics could show that middle schoolers check out more biographies than other groups or that 10:00–11:00 AM is the busiest time of day. Selections for Circulation statistic reports are done by date, site, or Statistics Groups.
Here are just a few examples of Alexandria's Circulation statistics reports. Learn about more in the Reporting section!
Usage by Period | Usage by Patron-Item Policy | Usage by Item Policy | Return Statistics |
However, unlike Monthly Usage statistics, Circulation statistic records aren’t linked to individual records that contribute to them. If you’d like to see information on individual patron, title, and copy records, it’d be best to use Monthly Usage statistics!
Uses
Here are some examples of information you can get from Circulation statistics:
- 11:00 AM is the busiest hour of the day.
- Mondays are the busiest day of the week.
- Patrons in 4th grade check out more fiction than biographies.
- Patrons in 8th grade use the library more than the 9th graders do.
- The most popular non-fiction area for those in 11th grade at your site is the 500's.
- Patrons in 12th grade never check out anything in the 200's.
- Jefferson Elementary School borrows the most from others in the district.
Use this information to plan library events and staff schedules. You can also determine if certain books need to be moved or promoted. Maybe a certain patron group needs more opportunities to come to the library, or maybe you need to order more science fiction novels for ninth graders.
Removing Statistics
Circulation statistics exist forever unless they’re intentionally removed through the Remove Circulation Statistics utility. This action isn't normally required and should only be done if you know these statistics are no longer useful for your reporting. Removing patron, title, or copy records doesn’t affect existing and historical Circulation statistic data.
Alexandria records policy-based statistics from the time that a patron or item is assigned to a policy and onward. Any statistics that were recorded in the past will reflect the policy that the patron or item was assigned to at the time.
Reporting
Here are some Alexandria reports that use Circulation statistics:
| Report Name | What does the report generate? |
|---|---|
| Usage by Period | Item usage statistics over different time periods |
| Usage by Patron Policy | Statistics showing how much different types of patrons are using the library |
| Usage by Patron-Item Policy | Usage statistics on various patron and item policy combinations with patron policies listed first |
| Usage by Item Policy | Statistics showing how much items with a specific policy are used during different time periods |
| Usage by Item-Patron Policy | Usage statistics on various item and patron policy combinations with item policies listed first |
| Return Statistics | Statistics on how many books have been returned each month and how close to the due date they were returned on average |
Why You Need Policies
In addition to setting up Circulation rules for different types of patrons and items, policies also determine what kind of statistics you can get out of Alexandria. Although you may feel that your needs will be satisfied by the barest, basic statistical data such as number of items checked out for the week, month, or year—you may not realize the powerful statistics that Alexandria can provide. Here are a few thought-provoking questions to consider:
- What role do statistics play in your library or district?
- Will you be referring to the statistical data that Alexandria gathers for you?
- Would more detailed statistics be beneficial to you and how?
- Is there a way to achieve very detailed statistical data?
Statistical Reports
Alexandria has many statistical reports. The Super Summary report details an amazing amount of statistical data about your collection, including the number of titles and copies, value, number or lost and discarded copies, collection age, and collection usage. And you can sort this information by call number, item policy, and medium. Other reports will show the number of items checked out, renewed, checked in, and the number of holds placed in a certain time period. All these are extremely useful statistics; however, other reports can provide statistics based on combinations of patron and item policies.
Using grouped patron and item policies generates statistical data that will empower you to view your collection and patrons with fresh eyes. For instance, a circulation of 3,615 items for the month may sound very impressive, but if you were able to compare the usage of one grade to another grade, you might be surprised by the results. Further, looking at the usage of one patron group compared to another in a particular area of your library collection could also be very informative.
For example, if you were to use a combination of patron and item policies to see how many biographies were being checked out by eighth graders (since a biography unit is part of their core curriculum) and you discover that absolutely no eighth graders had checked out biographies right before the end of the school year, what could you do? You can take a very close look at your biographies to determine if the reading level is too low, too high, or is so outdated that the students don’t recognize the names of the people whose biographies you have.
Setting Policies to Achieve Meaningful Statistics
Alexandria comes with two standard patron policies—Standard Patron and System Patron—and two standard item policies—Standard Item and System Item.
System Patrons/Items are used by Alexandria to set Lost and Discarded copies, etc.
Most librarians will establish their own policies. Generally, these are very simple, such as Student and Teacher or Book and Ebook. But let's look at how we can make these policies provide more meaningful statistics…
To achieve greater detail in your statistics, we suggest a policy (or Statistics Group) for each specific group of patrons or items that you wish to follow. In a school setting, this might be a policy for each grade or even each grade/gender (e.g. 6th Grade Girls). However, a public library might want to follow users from a geographical area and/or age (e.g. Norton Township or Norton Township Adults). Even if the circulation privileges of the group are the same as other groups, you should still create policies that are going to identify the patron groups you wish to follow. With more detail-specific policies, you can now see how many items are being checked out by each of these patron groups.
Item Policies Example
Let's take this idea a bit further by providing more detail in your item policies.
Perhaps you've set your item policies to general groups based upon the length of the checkout period: books for two weeks, reference with no circulation, audio-visual for one week, etc.
True, you could have a Fiction and a Non-Fiction policy instead, but consider being even more detailed in setting your policies. Instead of just Non-Fiction, think of the benefits of having a 000s policy, a 100s policy, a 200s policy, etc.
Now, your statistics become very useful.
So, what exactly is a Standard Item and who is a Standard Patron? All of a sudden, these designations seem much less useful when compared to the other groups mentioned above. Just think about how much more valuable these statistics could be if Non-Fiction was divided by the major divisions of the Dewey Decimal system.
Statistics Groups
When setting up your policies, you assign each policy a Statistics Group. This determines under which group this policy’s Circulation statistics will be gathered. In most cases, a policy’s Statistics Group can be the exact same as the policy, which is the default (e.g. a patron policy of 8th Grade will have a Statistics Group of 8th Grade as well).
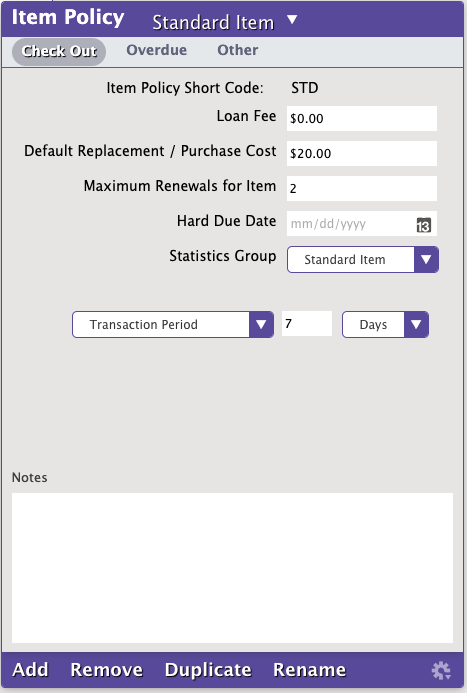
However, you can also use Statistics Groups to combine statistics for multiple policies. For example, you can have separate Fiction, Non-Fiction, and Equipment policies that all have the same Statistics Group: Standard. That way, the Circulation rules for all of those items would be different because of their policy, but all of their Circulation statistics would be collected under the Standard policy.
This should only be done if you have a clear reason for doing so and understand how they work.
Uses
Here are some cases in which you might want to have a Statistics Group that differs from the original policy:
Certain items may have different Transaction Periods or renewal rules, but it doesn't warrant a separate statistic.
- Extend your Transaction Period and/or maximum renewals for special non-fiction items that tend to be needed for longer periods of time.
- Keep high-demand items in circulation by shortening their Transaction Period.
Certain patrons and items may have different fees and fines, but it doesn't warrant a separate statistic.
- Encourage low-income students to use the library by assigning them a separate policy that keeps them from being fined.
- Some of the items in your collection may have a higher replacement cost, but otherwise belong with the rest of the collection.
Change the policy for holiday books separately during their holiday season.
Assign a Christmas policy to all your Christmas books, and change the Statistics Group to match one of your standard groups (Standard Item, Fiction, etc). During most of the year, their policy will match your standard policies. But when December rolls around, the Christmas policy can be changed to limit the length of time and how many Christmas books patrons can check out. Now everyone can have a Christmas book (instead of a book-hoarding few)! Once December is over, you only have to edit the Christmas policy to have the books return to matching your standard policies.
Collection Statistics
The Super Summary report has been removed as a result of Alexandria switching to a newer and more powerful report engine. We know that this useful report collated a wealth of information into a single source, and we are working to provide a newer version in the near future. In the meantime, you can use these alternative reports to generate statistics for your yearly library use and circulation. If you have feedback about Super Summary and the data you need, please submit an idea. We value your feedback!
See the Complete Reports List to learn more about Alexandria's reports and what they do.
Sign up for notifications on upcoming Alexandria updates and releases to stay informed.
Close attention should be paid to the Selection and Options settings, as these reports can be run by call number ranges in some instances, and date ranges in others. Options allow formatting to show more or less detailed information on item records and the ordering of the reports.
Brief Analysis - statistics on item counts, purchase costs, and replacement costs.
Usage by Period - shows item usage over different time periods.
Usage by Item Policy - statistics showing how much items with a specific policy are used during different time periods.
Publication Date Summary - title and copy statistics by publication year.
Titles Usage Reports - shows an overview of title statistics based on call number range and date range.
Copies Usage Reports - show a variety of statistics based on date range, call number range and patron circulation.
Copy Information - get a copy count of what has been added throughout the year.
Discarded Copies - shows all copies checked out to Discarded (2) and their reason.
Lost Copies - shows copies lost from patrons and inventory.
Weeding List - lists potential copies to weed based on condition, life to date usage, last use, or publication date.
Titles with No Copies - shows titles that do not have any copies, often this may include eBooks and other online resources.
See Inventory for gathering additional Collection Statistics.